Plot-lapse
CavlonTurn test photos into readings you can review and graph.
Example use case · Battery testing
How this step works
From meter readings to graphs
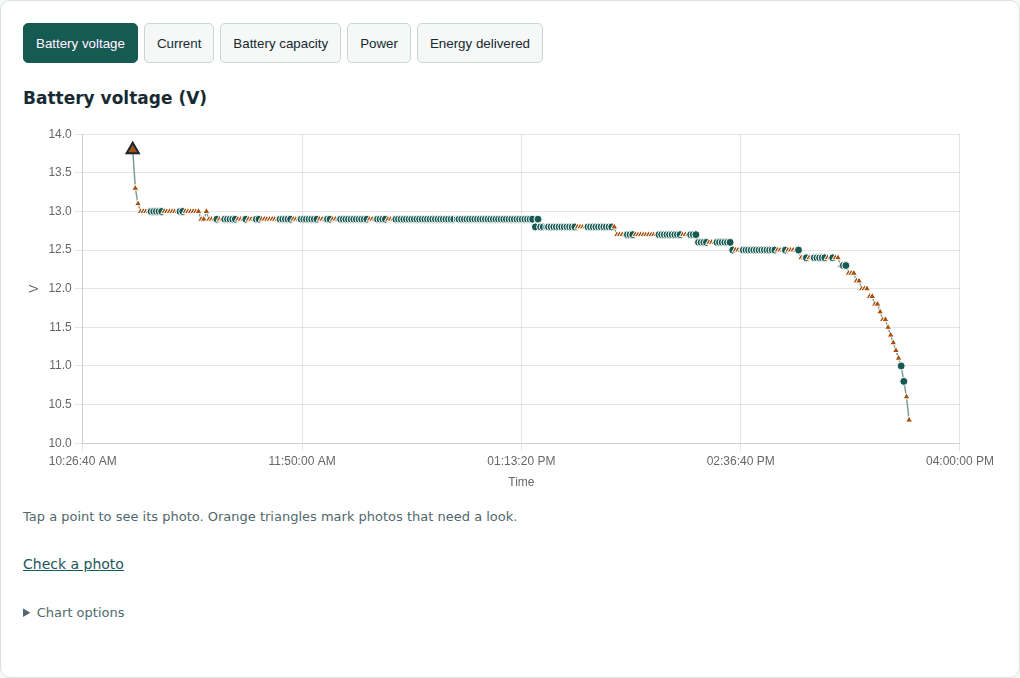
This battery test produces a discharge curve. Other tests use the measurements relevant to their subject, with CSV exports and graphs showing changes over time.
Built for Cavlon, Plot-lapse uses computer vision models to extract readings and organize them by time. The measurements and views depend on the subject of each test.
The saved battery-test example contains 308 photos. Source images stay available when a reading needs review.
My work: design, implementation & testingPython · Vision API · Review interface
Vision extraction & human review
Explore the project